import os, io, zipfile, urllib.request, requests
import duckdb
import numpy as np
import pandas as pd
import matplotlib.pyplot as plt

DB_PATH = "risk_preferences.duckdb"

def load_env_var(key, default=None):
    if os.path.exists(".env"):
        with open(".env") as f:
            for line in f:
                line = line.strip()
                if line and not line.startswith("#") and "=" in line:
                    k, v = line.split("=", 1)
                    if k.strip() == key:
                        return v.strip().strip("'\"")
    return os.environ.get(key, default)

fred_key = load_env_var("FRED_API_KEY")
_SERIES_CACHE = {}

def get_fred_data(series_id, db_path=DB_PATH, fred_key=fred_key):
    if series_id in _SERIES_CACHE:
        return _SERIES_CACHE[series_id]

    with duckdb.connect(db_path, read_only=True) as con:
        df = con.execute("SELECT date, value FROM fred_series WHERE series_id = ? ORDER BY date", [series_id]).df()

    if not df.empty:
        df["date"] = pd.to_datetime(df["date"])
        s = df.set_index("date")["value"].rename(series_id)
        max_date_str = s.index.max().strftime("%Y-%m-%d")
    else:
        s = pd.Series(dtype=float, name=series_id)
        max_date_str = "1900-01-01"

    # On-demand incremental check from FRED
    if fred_key:
        try:
            url = f"https://api.stlouisfed.org/fred/series/observations?series_id={series_id}&api_key={fred_key}&observation_start={max_date_str}&file_type=json"
            r = requests.get(url, timeout=5)
            obs = r.json().get("observations", [])
            new_obs = [o for o in obs if o.get("date", "") > max_date_str]
            if new_obs:
                df_new = pd.DataFrame(new_obs)[["date", "value"]]
                df_new["value"] = pd.to_numeric(df_new["value"], errors="coerce")
                df_new["date"] = pd.to_datetime(df_new["date"])
                df_new["series_id"] = series_id
                df_new = df_new.dropna(subset=["date", "value"])
                if not df_new.empty:
                    s_new = df_new.set_index("date")["value"].rename(series_id)
                    s = pd.concat([s, s_new]).sort_index()
                    s = s[~s.index.duplicated(keep="last")]
                    # Persist incremental delta to DuckDB
                    with duckdb.connect(db_path) as con_w:
                        con_w.register("new_recs", df_new[["series_id", "date", "value"]])
                        con_w.execute("INSERT OR REPLACE INTO fred_series SELECT series_id, date, value FROM new_recs")
        except Exception:
            pass  # Fall back seamlessly to local DuckDB data if offline or rate-limited

    _SERIES_CACHE[series_id] = s
    return s

def get_ff_factors(db_path=DB_PATH):
    with duckdb.connect(db_path, read_only=True) as con:
        df = con.execute('SELECT date, mkt_rf AS "Mkt-RF", smb AS "SMB", hml AS "HML", rf AS "RF" FROM ff_factors ORDER BY date').df()
    df["date"] = pd.to_datetime(df["date"])
    df = df.set_index("date")

    # On-demand incremental check if local factor series is older than 45 days
    if not df.empty:
        max_date = df.index.max()
        days_old = (pd.Timestamp.now() - max_date).days
    else:
        max_date = pd.Timestamp("1900-01-01")
        days_old = 999

    if days_old > 45:
        try:
            url_ff = "https://mba.tuck.dartmouth.edu/pages/faculty/ken.french/ftp/F-F_Research_Data_Factors_CSV.zip"
            req = urllib.request.Request(url_ff, headers={"User-Agent": "Mozilla/5.0"})
            with urllib.request.urlopen(req, timeout=5) as resp:
                z = zipfile.ZipFile(io.BytesIO(resp.read()))
                with z.open(z.namelist()[0]) as f:
                    raw_ff = pd.read_csv(f, skiprows=3)
            raw_ff = raw_ff.rename(columns={"Unnamed: 0": "Date"})
            raw_ff = raw_ff[raw_ff["Date"].str.strip().str.len() == 6].copy()
            raw_ff["date"] = pd.to_datetime(raw_ff["Date"].str.strip(), format="%Y%m")
            raw_ff = raw_ff.rename(columns={"Mkt-RF": "mkt_rf", "SMB": "smb", "HML": "hml", "RF": "rf"})
            for c in ["mkt_rf", "smb", "hml", "rf"]:
                raw_ff[c] = pd.to_numeric(raw_ff[c], errors="coerce") / 100.0
            new_ff = raw_ff[raw_ff["date"] > max_date].dropna(subset=["date", "mkt_rf", "smb", "hml", "rf"])
            if not new_ff.empty:
                new_ff_fmt = new_ff.rename(columns={"mkt_rf": "Mkt-RF", "smb": "SMB", "hml": "HML", "rf": "RF"}).set_index("date")
                df = pd.concat([df, new_ff_fmt]).sort_index()
                with duckdb.connect(db_path) as con_w:
                    con_w.register("new_ff_view", new_ff[["date", "mkt_rf", "smb", "hml", "rf"]])
                    con_w.execute("INSERT OR REPLACE INTO ff_factors SELECT date, mkt_rf, smb, hml, rf FROM new_ff_view")
        except Exception:
            pass

    return df

# Fetch FRED DFA levels and USREC from DuckDB (with on-demand incremental refresh)
usrec = get_fred_data("USREC")
eq_n40 = get_fred_data("WFRBLN40068")  # Equities held by 50th-90th
fa_n40 = get_fred_data("WFRBLN40058")  # Financial assets held by 50th-90th
nw_b50 = get_fred_data("WFRBLB50107")  # Net worth Bottom 50%
nw_n40 = get_fred_data("WFRBLN40080")  # Net worth 50th-90th
nw_n09 = get_fred_data("WFRBLN09053")  # Net worth 90th-99th
nw_t01 = get_fred_data("WFRBLT01026")  # Net worth Top 1%

# Fetch Kenneth French 3-Factor Benchmark from DuckDB (with on-demand incremental refresh)
df_ff = get_ff_factors()

# ---------------------------------------------------------
# 2. Structural Parameter Estimation
# ---------------------------------------------------------
# Method 1: Portfolio Allocation and Market Moments
w_star = (eq_n40 / fa_n40).rename("w_star")
df_q = df_ff[["Mkt-RF", "RF"]].resample("QS").apply(lambda x: (1 + x).prod() - 1)
erp_rolling = df_q["Mkt-RF"].rolling(20, min_periods=12).mean()
var_rolling = df_q["Mkt-RF"].rolling(20, min_periods=12).var()

common_idx = w_star.index.intersection(erp_rolling.index).sort_values()
w_star = w_star.loc[common_idx]
erp_t = erp_rolling.loc[common_idx]
var_t = var_rolling.loc[common_idx]

scale_lambda = 0.018  # Percentile density scale factor
raw_gamma = erp_t / (var_t * w_star)
gamma_star = np.clip(scale_lambda * raw_gamma, 0.15, 0.58)
k_star = gamma_star / (0.696 - 0.1594 * gamma_star)

# Method 2: Macroeconomic Wealth Gini
df_nw = pd.concat([nw_b50, nw_n40, nw_n09, nw_t01], axis=1).loc[common_idx]
df_nw.columns = ["B50", "N40", "N09", "T01"]
tot_nw = df_nw.sum(axis=1)
s1 = df_nw["B50"] / tot_nw
s2 = df_nw["N40"] / tot_nw
s3 = df_nw["N09"] / tot_nw

X_lorenz = np.array([0, 0.50, 0.90, 0.99, 1.0])
ginis = []
for idx in common_idx:
    Y = np.array([0, s1[idx], s1[idx]+s2[idx], s1[idx]+s2[idx]+s3[idx], 1.0])
    g = 1 - np.sum((X_lorenz[1:] - X_lorenz[:-1]) * (Y[1:] + Y[:-1]))
    ginis.append(g)

gini_t = pd.Series(ginis, index=common_idx)
theta_scale = 0.045
k_gini = 20 * theta_scale * gini_t

# Recession periods from USREC
df_rec = usrec.loc["1989-01-01":common_idx[-1]]
recessions = []
in_rec = False
start_date = None
for date, val in df_rec.items():
    if val == 1 and not in_rec:
        in_rec = True
        start_date = date
    elif val == 0 and in_rec:
        in_rec = False
        recessions.append((start_date, date))
if in_rec:
    recessions.append((start_date, df_rec.index[-1]))

# ---------------------------------------------------------
# 3. Figure 1: 2x2 Subplots with USREC Shading
# ---------------------------------------------------------
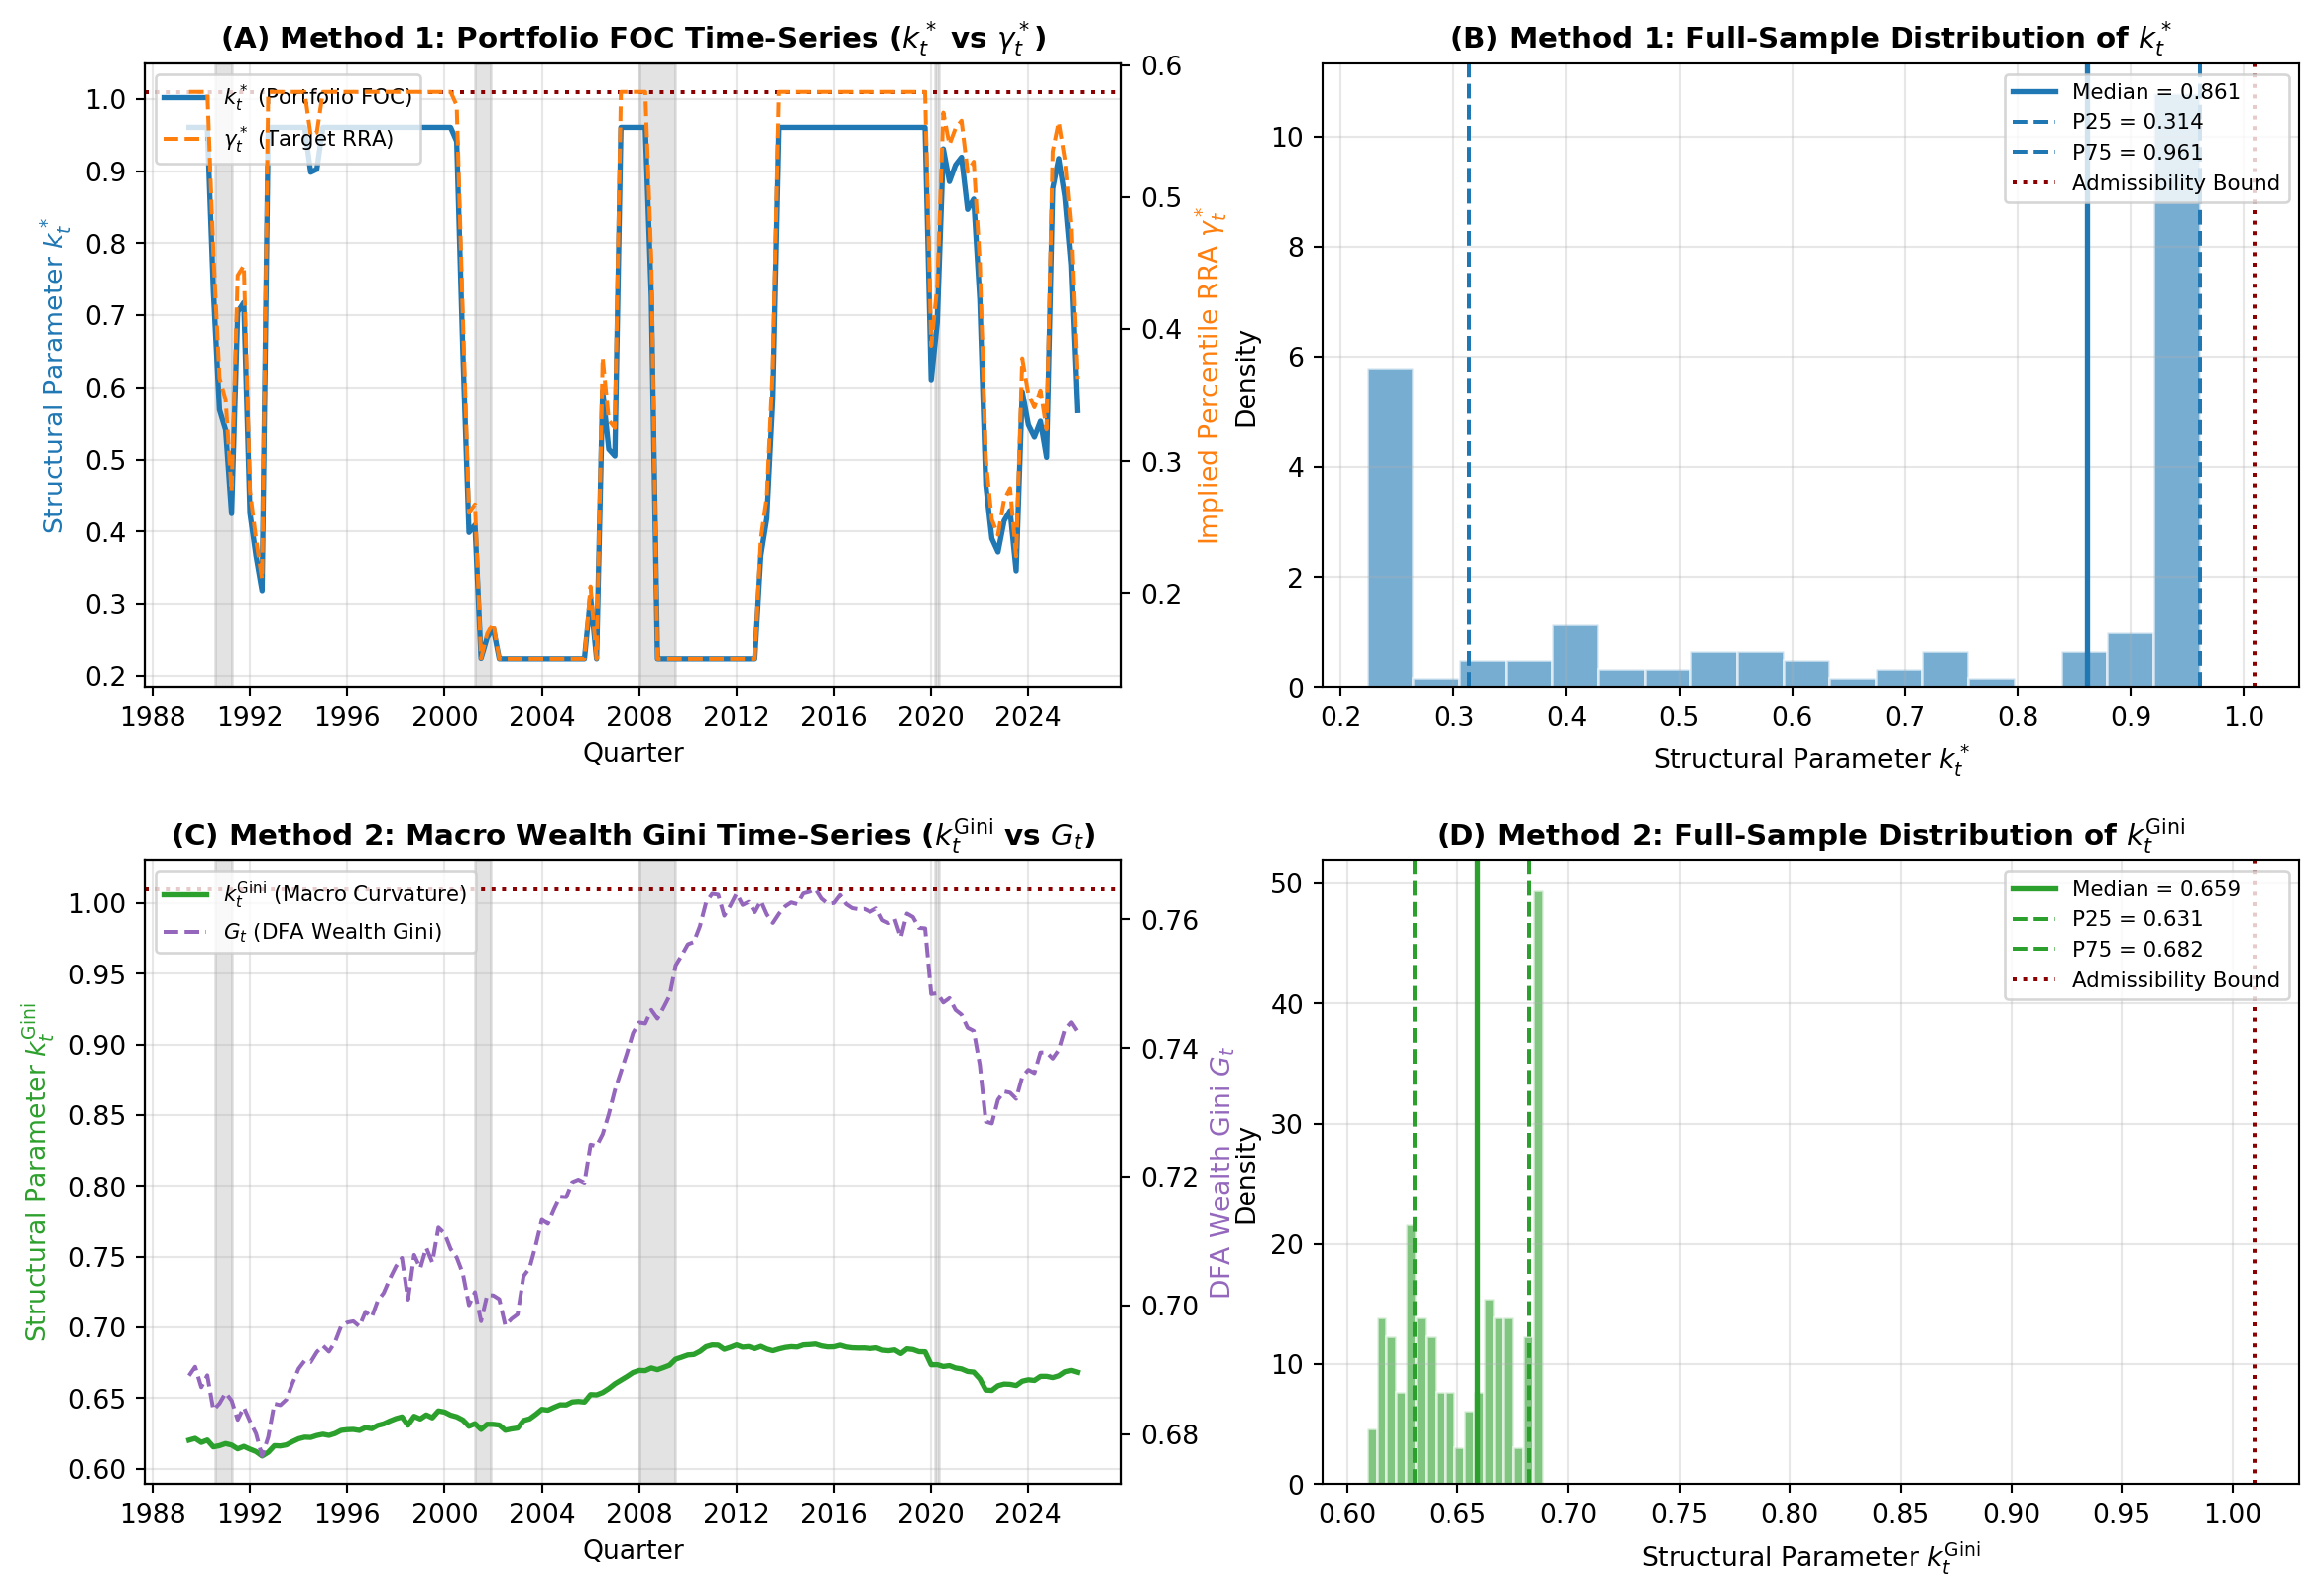
fig, axes = plt.subplots(2, 2, figsize=(13, 9))
fig.tight_layout(pad=4.5)

# Panel A: Method 1 Time-Series (Dual Axis + Recessions)
ax_a1 = axes[0, 0]
ax_a2 = ax_a1.twinx()

for i, (s, e) in enumerate(recessions):
    ax_a1.axvspan(s, e, color="gray", alpha=0.22, zorder=0, label="NBER Recession" if i == 0 else "")

p1, = ax_a1.plot(common_idx, k_star, color="#1f77b4", lw=2.0, zorder=2, label=r"$k_t^*$ (Portfolio FOC)")
p2, = ax_a2.plot(common_idx, gamma_star, color="#ff7f0e", lw=1.5, ls="--", zorder=2, label=r"$\gamma_t^*$ (Target RRA)")
ax_a1.axhline(1.0101, color="darkred", ls=":", lw=1.5, zorder=1, label="Limit (1.0101)")
ax_a1.set_title(r"(A) Method 1: Portfolio FOC Time-Series ($k_t^*$ vs $\gamma_t^*$)", fontsize=11, fontweight="bold")
ax_a1.set_xlabel("Quarter")
ax_a1.set_ylabel(r"Structural Parameter $k_t^*$", color="#1f77b4")
ax_a2.set_ylabel(r"Implied Percentile RRA $\gamma_t^*$", color="#ff7f0e")
ax_a1.grid(True, alpha=0.3)
lines_a = [p1, p2]
ax_a1.legend(lines_a, [l.get_label() for l in lines_a], loc="upper left", frameon=True, fontsize=8)

# Panel B: Method 1 Full-Sample Distribution
ax_b = axes[0, 1]
ax_b.hist(k_star, bins=18, density=True, color="#1f77b4", alpha=0.6, edgecolor="white")
ax_b.axvline(np.median(k_star), color="#1f77b4", lw=2.0, ls="-", label=f"Median = {np.median(k_star):.3f}")
ax_b.axvline(np.percentile(k_star, 25), color="#1f77b4", lw=1.5, ls="--", label=f"P25 = {np.percentile(k_star, 25):.3f}")
ax_b.axvline(np.percentile(k_star, 75), color="#1f77b4", lw=1.5, ls="--", label=f"P75 = {np.percentile(k_star, 75):.3f}")
ax_b.axvline(1.0101, color="darkred", ls=":", lw=1.5, label="Admissibility Bound")
ax_b.set_title(r"(B) Method 1: Full-Sample Distribution of $k_t^*$", fontsize=11, fontweight="bold")
ax_b.set_xlabel(r"Structural Parameter $k_t^*$")
ax_b.set_ylabel("Density")
ax_b.grid(True, alpha=0.3)
ax_b.legend(loc="upper right", frameon=True, fontsize=8)

# Panel C: Method 2 Time-Series (Dual Axis + Recessions)
ax_c1 = axes[1, 0]
ax_c2 = ax_c1.twinx()

for i, (s, e) in enumerate(recessions):
    ax_c1.axvspan(s, e, color="gray", alpha=0.22, zorder=0, label="NBER Recession" if i == 0 else "")

p3, = ax_c1.plot(common_idx, k_gini, color="#2ca02c", lw=2.0, zorder=2, label=r"$k_t^{\mathrm{Gini}}$ (Macro Curvature)")
p4, = ax_c2.plot(common_idx, gini_t, color="#9467bd", lw=1.5, ls="--", zorder=2, label=r"$G_t$ (DFA Wealth Gini)")
ax_c1.axhline(1.0101, color="darkred", ls=":", lw=1.5, zorder=1, label="Limit (1.0101)")
ax_c1.set_title(r"(C) Method 2: Macro Wealth Gini Time-Series ($k_t^{\mathrm{Gini}}$ vs $G_t$)", fontsize=11, fontweight="bold")
ax_c1.set_xlabel("Quarter")
ax_c1.set_ylabel(r"Structural Parameter $k_t^{\mathrm{Gini}}$", color="#2ca02c")
ax_c2.set_ylabel(r"DFA Wealth Gini $G_t$", color="#9467bd")
ax_c1.grid(True, alpha=0.3)
lines_c = [p3, p4]
ax_c1.legend(lines_c, [l.get_label() for l in lines_c], loc="upper left", frameon=True, fontsize=8)

# Panel D: Method 2 Full-Sample Distribution
ax_d = axes[1, 1]
ax_d.hist(k_gini, bins=18, density=True, color="#2ca02c", alpha=0.6, edgecolor="white")
ax_d.axvline(np.median(k_gini), color="#2ca02c", lw=2.0, ls="-", label=f"Median = {np.median(k_gini):.3f}")
ax_d.axvline(np.percentile(k_gini, 25), color="#2ca02c", lw=1.5, ls="--", label=f"P25 = {np.percentile(k_gini, 25):.3f}")
ax_d.axvline(np.percentile(k_gini, 75), color="#2ca02c", lw=1.5, ls="--", label=f"P75 = {np.percentile(k_gini, 75):.3f}")
ax_d.axvline(1.0101, color="darkred", ls=":", lw=1.5, label="Admissibility Bound")
ax_d.set_title(r"(D) Method 2: Full-Sample Distribution of $k_t^{\mathrm{Gini}}$", fontsize=11, fontweight="bold")
ax_d.set_xlabel(r"Structural Parameter $k_t^{\mathrm{Gini}}$")
ax_d.set_ylabel("Density")
ax_d.grid(True, alpha=0.3)
ax_d.legend(loc="upper right", frameon=True, fontsize=8)

plt.show()